Auto Assessment
Auto-Play
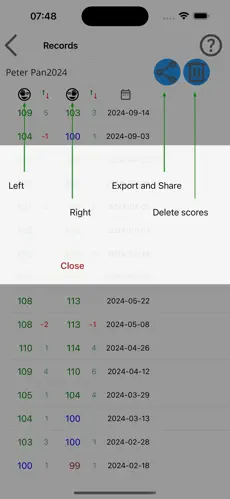
In Auto-play, the app calculates the score. And you can save scores of each assessment for yourself or other test subjects.
Recording and Reviewing Scores
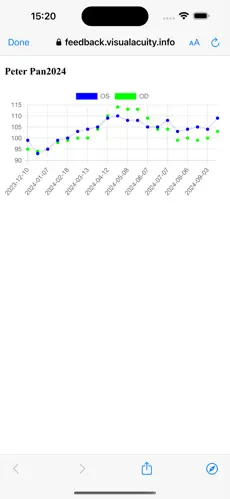
- By enabling “Record Scores” in Settings, you can track the progression of your visual acuity over time.
Time limit for recognizing optotypes
- By default, the "Play Interval Until Next Optotype" setting is None.
Available intervals (in seconds): 2, 4, 6, 8, and 10. - If the test subject fails to recognize the optotype within the time limit, it is counted as a miss.
Score Review Indicators
- A score of 100 in blue indicates the reference standard.
- Scores above 100 in green suggest no myopia.
- Scores below 100 in red may indicate possible myopia.


LogMAR, MAR and VAS notation
- The assessment ends when a row has at least one optotype missed.
- The best row read is the row with the smallest optotypes that the test subject can accurately identify.
- The best row missed is the next row with smaller optotypes, where the test subject misses at least one optotype but reads at least one.
Scoring Formula
- The score is calculated using the formula:
(LogMAR value of the best row missed) + 0.02 × (number of optotypes missed)
Alternatively, the equivalent formula is:
(LogMAR value of the best row read) - 0.02 × (number of optotypes read in the next row)
(Each row contains 5 optotypes.)
Hints:
- Due to the limited width of smartphones, the Eye Charts app shows 1 or 3 optotypes of top rows with large optotypes at a time, however, the app loops through 5 optotypes of the same row. During auto-play, the test subject should read the middle optotype being displayed.
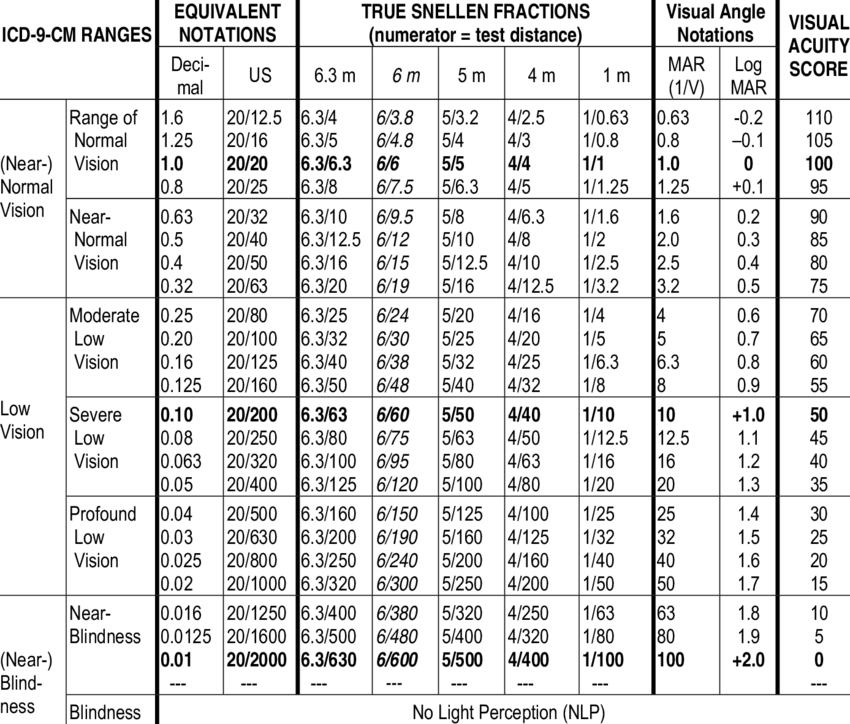
For VAS notation, the score is an inversion of the LogMAR scale, based on formula VAS=100-50xlogMAR. It is more intuitive since higher values indicate better visual acuity.
For MAR notation, the score is 10^(LogMAR).
Other notations
- The assessment ends when more than 50% of optotypes in a row are missed, such as 3 out of 5.
- The best row read is the row with the smallest optotypes where the test subject can correctly identify more than 50%, for example, 3 out of 5.
- The score is (LogMAR value of the best row read) + 0.02 x (number of optotypes missed)
References:
- The validity of visual acuity assessment using mobile technology devices in the primary care setting
- A comparison of two methods of LogMAR visual acuity data scoring for statistical analysis (PDF download)
- Visual Acuity Ranges and Visual Acuity Notations from researchgate.net
